

Price and ratings
- Price
- ₹499.00
- Rating
- —
- Ratings
- 0India
Versions
- Released
- 29 Apr 20265 months ago
- Last update
- 3 months agoVersion 1.3
- Requires
- iOS 26.1 or later
Details
- Size
- 9.2 MB
- Languages
- 1
o11ybot is your mobile observability companion for Elastic. Connect to your Kibana Agent Builder MCP endpoint with a server URL and API key, then monitor applications, synthetics, hosts, and workflows from your iPhone. WHAT YOU GET • Applications — service inventory with latency, throughput, and error rate; drill into traces, metrics, and logs per service • Synthetics — monitor uptime and response time for synthetic checks • Hosts — CPU and memory utilization across your infrastructure •…
Competitors
Full chartTop of Paid · Developer Tools in India. ObservabilityBot isn't in it right now. Changes are over 7 days.
- #1 (number one)Change unknown
 Internet Speed LimiterNeuralQuark
 - #2Change unknown
 Text Editor - Document EditorSupagarn Pattananuchart
 - #3New entry
 Modbus Poll MobileMuh Syafiudin
 - #4New entry
 GizmoSQLGizmo Data LLC
 - #5Change unknown
 Termix Pro: SSH & SFTP ClientSimon Zvara
 - #6Change unknown
 Echo - SSH + Mosh ClientReplay Software Limited
 - #7Change unknown
 MuxySaeed Vaziry
 - #8Change unknown
 Code Appthebaselab Ltd
 - #9Change unknown
 OpenTermCHENGDU MIAOZHI TECHNOLOGY CO., LTD.
 - #10Change unknown
 Smart NFCAlec O'Connor
 - #11Change unknown
 Simple Server: HTTP ServerBitsbaker LLC.
 - #12Change unknown
 ESP32 BLE TerminalGopi Gadhiya
 - #13Change unknown
 Inspect BrowserParallax Dynamics Inc.
 - #14Change unknown
 GrafanaUIRoman Senchuk
 - #15Change unknown
 ScarletSteven Troughton-Smith
 - #16Change unknown
 Claude Remote Controlibiz tech company limited
 - #17Change unknown
 PromoCodes - Redeem Codeheping wang
 - #18Change unknown
 Speechable - Text to VoiceChakMing Wong
 - #19Change unknown
 Juno Connect: Jupyter ClientRational Matter
 - #20Change unknown
 SSH Tunnel: VPN & SOCKS5 proxyMobibean, LLC
Store listing
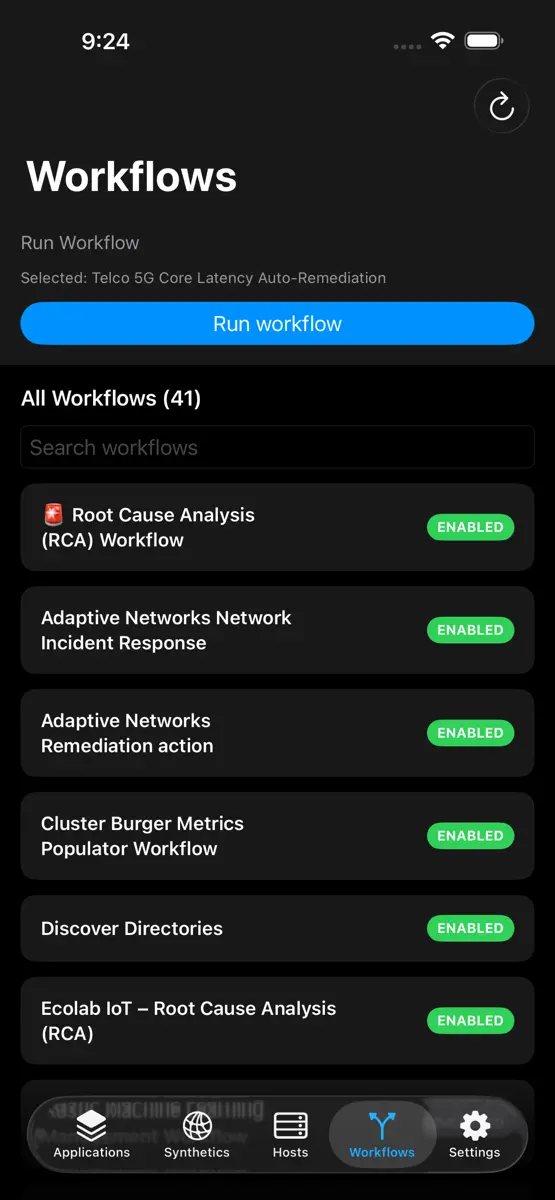
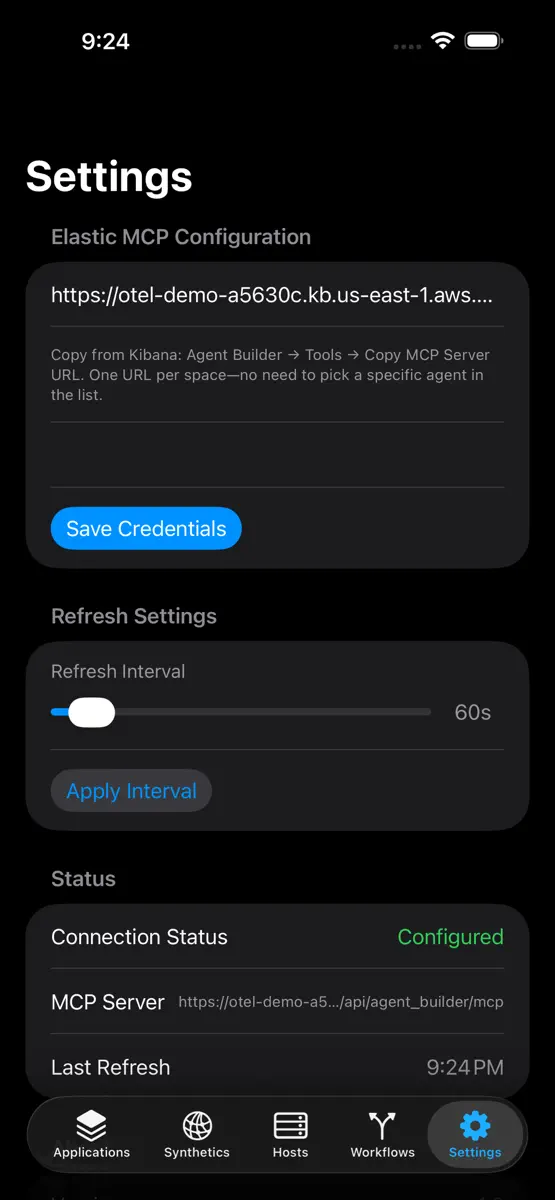
How the app presents itself on the App Store. Select a screenshot to open it full size.
What's new
Version 1.3 · 5 Jul 2026 · 3 months ago
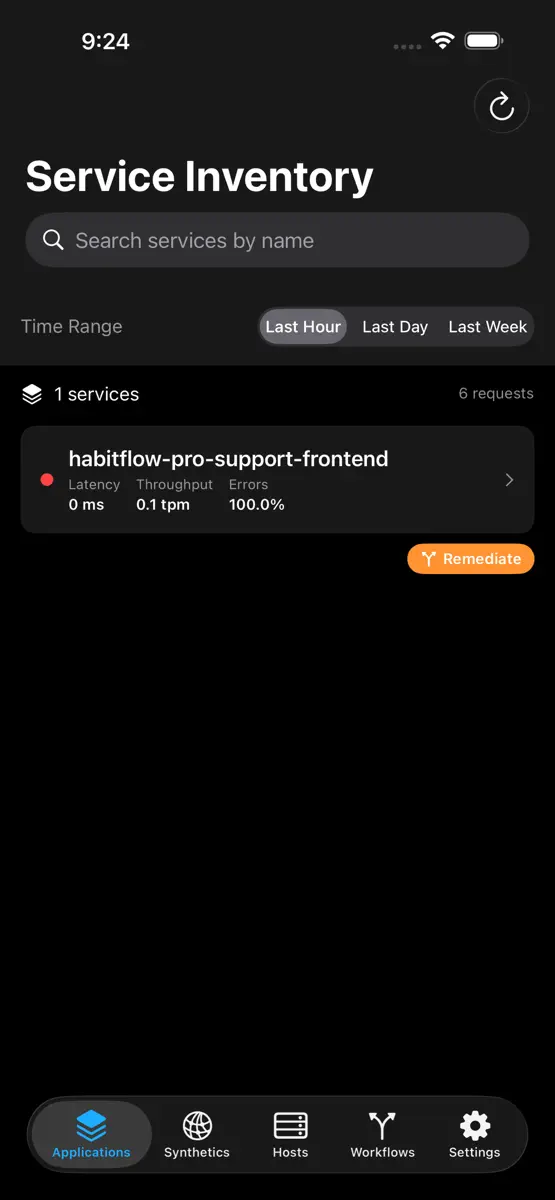
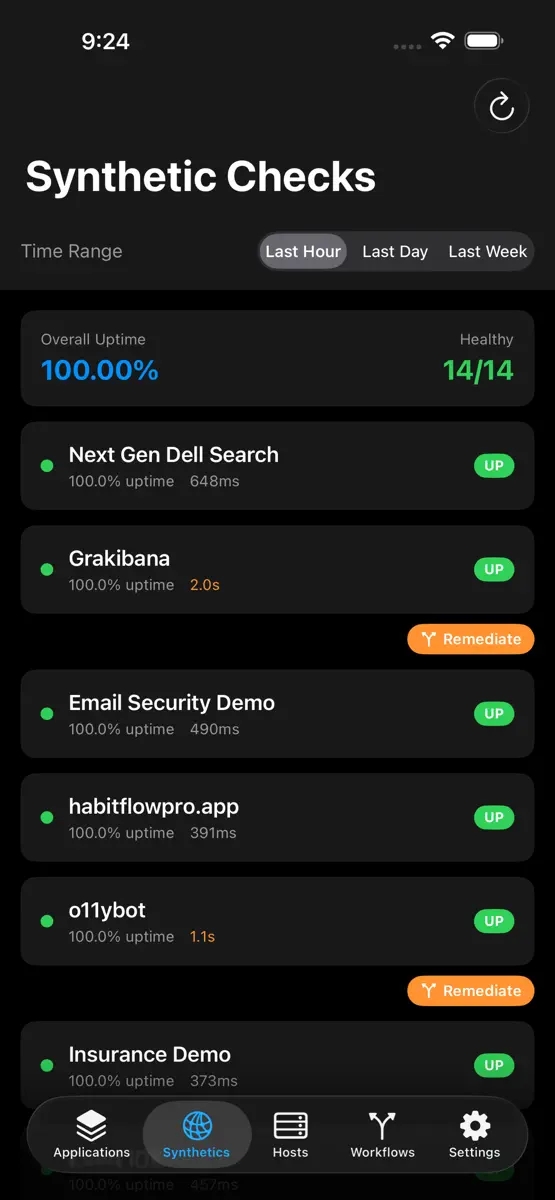
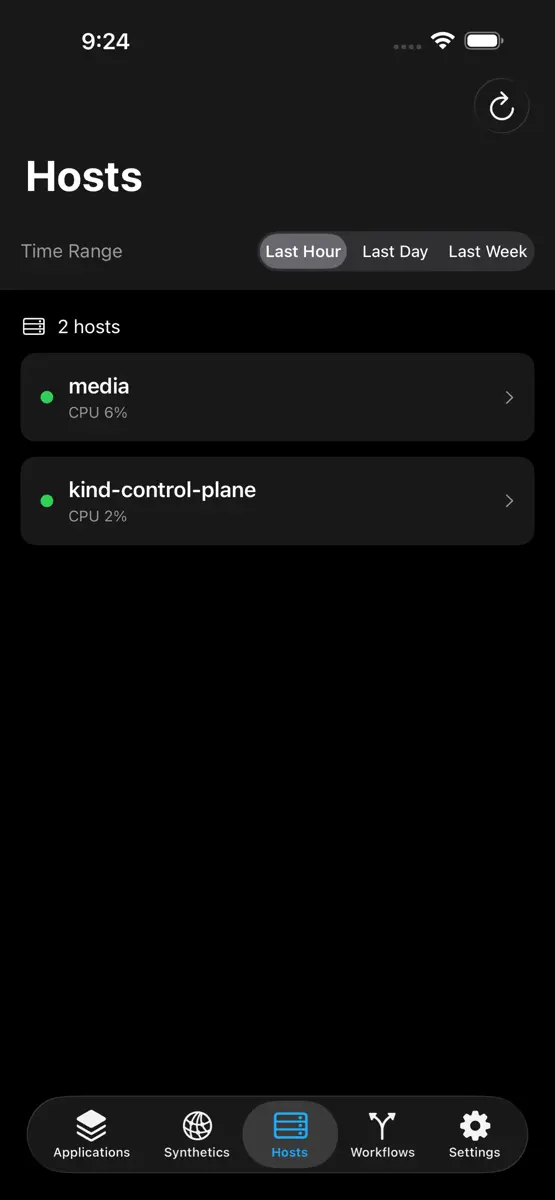
What's New in 1.3 o11ybot 1.3 is a major update focused on a cleaner mobile workflow for Elastic Observability—and on letting you act on issues, not just view them. NEW TAB-BASED EXPERIENCE The app is reorganized around five focused tabs: • Applications — searchable service inventory with latency, throughput, and error rate for each APM service. Tap a service to drill into metrics, traces, and logs without leaving the app. • Synthetics — overall uptime plus per-monitor status, response time, and last check time. Time range filters match the rest of the app (Last Hour, Last Day, Last Week). • Hosts — CPU and memory utilization across your infrastructure from OpenTelemetry host metrics. • Workflows — browse your full Kibana workflow catalog, review recent runs, and trigger workflows directly from your iPhone. • Settings — streamlined MCP configuration (server URL, API key, and refresh interval). WORKFLOWS & REMEDIATION • New Workflows tab lists workflow definitions from Kibana alongside recent execution history. • Run workflow from the Workflows tab with live observability context passed into workflow inputs. • Run workflow buttons on Applications and Synthetics when something needs attention—start remediation from the screen where you spotted the problem. • Improved workflow discovery merges Kibana definitions with recent runs so you see the full picture, not just a handful of report indices. • Fixed Elastic Observability Serverless workflow execution (correct API path and inputs for run requests). APPLICATIONS / SERVICE INVENTORY • Replaces the old dashboard card layout with a dedicated service inventory view. • Search services by name and filter by time range. • Per-service detail views for deeper investigation. SYNTHETICS & HOSTS • More reliable synthetics loading with fallback ES|QL queries and improved data parsing across Elastic deployments. • Dedicated Hosts tab for at-a-glance CPU and memory across monitored hosts. SETTINGS & SETUP • Simpler settings focused on connecting to your Elastic MCP endpoint—copy the URL from Kibana Agent Builder → Tools. • Credentials remain stored securely in the iOS Keychain on your device. ALSO IN THIS RELEASE • Watch app companion fixes (correct bundle ID and proper embedding in the iOS app). • Updated in-app experience and marketing assets for the new layout. • General stability and release-build improvements. REQUIREMENTS (unchanged) An Elastic Serverless project with MCP access and an API key for your Kibana space. Setup guide: o11ybot.app Thank you for using o11ybot. If this update helps your on-call or incident workflow, please leave a review—we read every one. o11ybot is an independent app and is not affiliated with or endorsed by Elastic N.V.
Current rankings
Every chart this app is in right now, best position first.
Not charting right now
This app isn't in any tracked top 100 at the moment. Its history below shows when it was.
Rank history
Higher on the chart is better: #1 is at the top.
No chart history to show
History appears for charts the app is currently in.
Ranking events
Entries, big moves, #1s and new versions we've recorded.
No events recorded yet
Events appear as the app enters charts, moves 25+ places or ships a new version.