

Price and ratings
- Price
- CA$19.99
- Rating
- —
- Ratings
- 0Canada
Versions
- Released
- 10 Sep 202629 days ago
- Last update
- 10 days agoVersion 1.2.2
- Requires
- iOS 26.0 or later
Details
- Size
- 8.5 MB
- Languages
- —
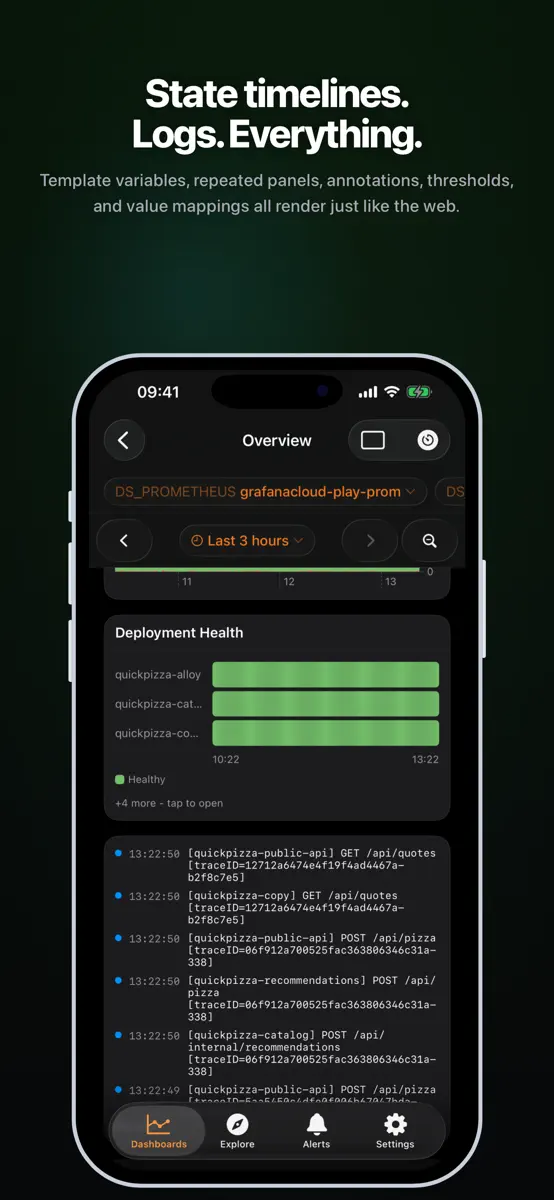
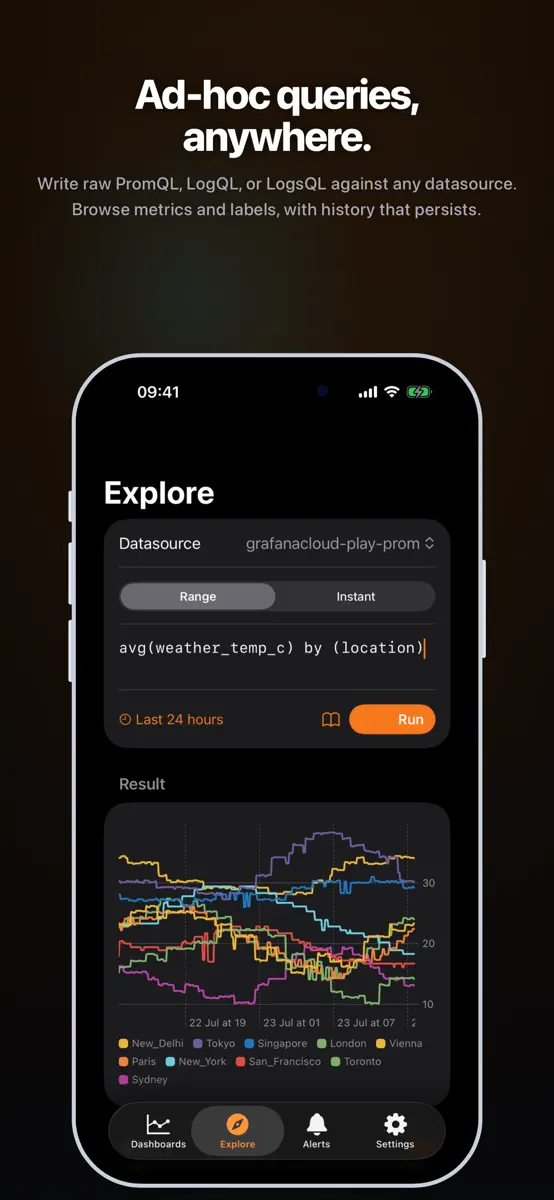
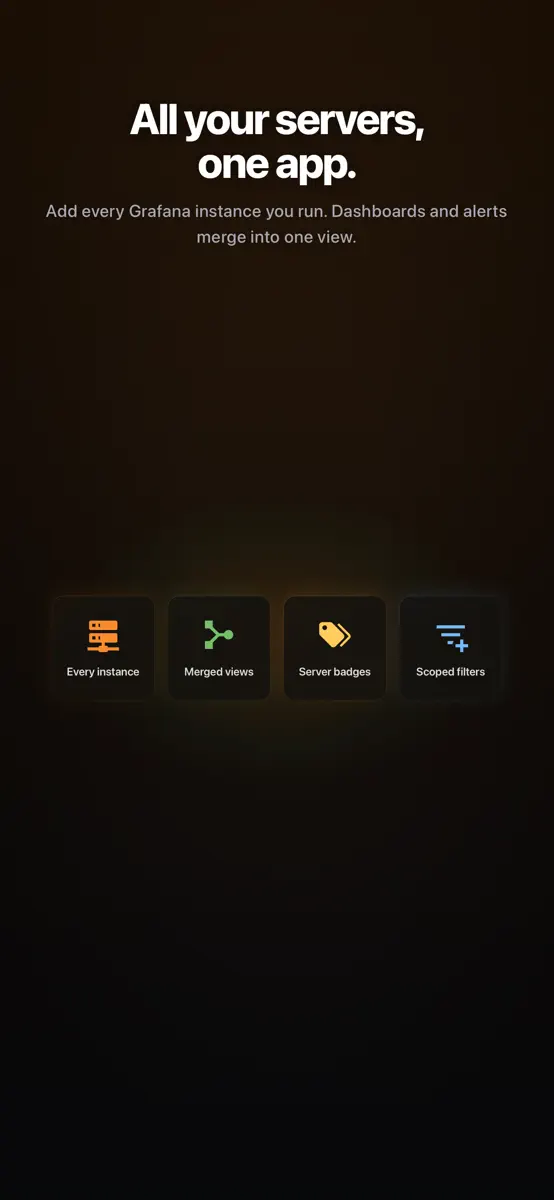
Gaugely is a fast, fully native viewer for your self-hosted Grafana dashboards. No embedded web pages and no image renderer: panels are re-rendered with Swift Charts, so dashboards feel like a real iOS app - smooth scrolling, crisp charts, proper dark mode, widgets, and Siri shortcuts. Connect one or more Grafana servers using a service-account token, basic auth, or anonymous access. Reverse-proxy SSO setups work through custom headers, and self-signed certificates or plain-HTTP homelab…
Competitors
Full chartTop of Paid · Developer Tools in Canada. Gaugely for Grafana is #65 there. Changes are over 7 days.
- #1 (number one)Change unknown
 SQLed - SQL Datenbank ManagerAndreas Zimnas
 - #2Change unknown
 VibemasterJeremy Yablan
 - #3Change unknown
 Python ChallengeMUSTAFA GURBUZ
 - #4Change unknown
 iRTSPRyan Rudes
 - #5Change unknown
 Smart NFCAlec O'Connor
 - #6Change unknown
 Inspect BrowserParallax Dynamics Inc.
 - #7Change unknown
 Echo - SSH + Mosh ClientReplay Software Limited
 - #8Change unknown
 LadderTouchMotonari Hibi
 - #9Change unknown
 SSH Tunnel: VPN & SOCKS5-ProxyMobibean, LLC
 - #10Change unknown
 Code Appthebaselab Ltd
 - #11Change unknown
 OpenTermCHENGDU MIAOZHI TECHNOLOGY CO., LTD.
 - #12Change unknown
 Logger for ShortcutsSnailed It Development Ltd
 - #13Change unknown
 Continuous .NET C# and F# IDEKrueger Systems, Inc.
 - #14Change unknown
- #15Change unknown
 Source 3Street Coder LLC
 - #16Change unknown
 Termix Pro: SSH & SFTP ClientSimon Zvara
 - #17Change unknown
 Hexer — Hex File ViewerHans Schulein
 - #18Change unknown
 Adaptivity (A)Geoff Hackworth
 - #19Change unknown
 PasteMe - Pastebin ClientRanduSoft SRL
 - #20Change unknown
 ESP32 BLE TerminalGopi Gadhiya

Store listing
How the app presents itself on the App Store. Select a screenshot to open it full size.






What's new
Version 1.2.2 · 29 Sep 2026 · 10 days ago
Dashboards look and behave much more like they do in Grafana, with transformations, faster ways to find a dashboard, sharing and exporting, and iPad windows. DASHBOARDS - Grafana transformations run in the app: organize, filter and rename fields, join, merge, concatenate, reduce, series to rows, filter by value, labels to fields, sort, limit and add field from calculation. A transformation the app does not support yet shows the data up to that step and says which step was skipped. - Rows appear as sections you can collapse. A collapsed row only queries its panels when you open it, so large dashboards load faster. - Library panels load from Grafana's panel library, and dashboards saved in Grafana's new layout format (tabs and auto grid) open, including on Grafana 12.0 to 12.3. - Panels with their own relative time or time shift query that window and show it under the title. - The dashboard's time zone and week start apply to time ranges and to every time label. - Server-side expressions (math, reduce, resample) run and render. - Every Grafana variable format works (quoted, SQL string, JSON, Lucene, query parameter, percent-encoded, date, text and more), and ${__from}, ${__to}, ${__url_time_range} and ${__all_variables} work in queries and links. - Dashboards open faster and redraw less while panels load. BROWSING AND SHARING - Starred and Recently viewed sections at the top of the dashboard list, and nested folders as breadcrumb sections. - Paste, drop or share a Grafana dashboard link to open it with its time range, variables and panel. - Copy a panel's query, open it in Explore, or share its data as CSV from the panel menu. Alert rules open in Explore too. PANELS - Many more Grafana units: temperature, power and energy, pressure, data sizes and rates, clocks and durations, dates and times, and custom units. - Field overrides apply to stat, gauge, bar gauge and table panels. - Time series support negative-Y for in/out pairs, series hidden by overrides, and a right-hand axis. - Stat panels support more calculations, such as median, standard deviation and percentiles. IPAD AND KEYBOARD - Open a dashboard in its own window on iPad. - Keyboard shortcuts: refresh, move the time range, zoom out, search, switch tabs, open a link, and run in Explore. WIDGETS AND CONTROLS - The panel widget comes in a large size and in Lock Screen sizes, with a refresh button. - A Control Center control shows firing alerts and opens the Alerts tab. - Value mappings, such as 1 shown as a green "UP", appear on widgets and in the Live Activity. PRIVACY - App Lock now also covers sheets, full-screen views and the app switcher preview, and Lock Screen widgets and the control hide their values while it is on. FIXES - Stat, table and bar panels no longer show "No data" on short time ranges such as the last 15 minutes. - The chart tooltip sits above bars and filled areas. - Bar chart labels stay horizontal unless the panel rotates them. - Narrow stat and gauge panels keep their proportions on a phone.
Current rankings
Every chart this app is in right now, best position first.
| Chart | Rank | 24 h | 7 days | Best | Days on chart |
|---|---|---|---|---|---|
| Canada· Paid · Developer Tools | #65 | Change unknown | Change unknown | #60 | 2 |
| Germany· Paid · Developer Tools | #90 | Change unknown | Change unknown | #76 | 2 |
Rank history
Higher on the chart is better: #1 is at the top.
Sign in to see 30 days, 90 days and all history.
Canada · Paid · Developer Tools: best #60, latest #65, over 2 snapshots since 8 Oct. No snapshots from 8 Oct to 9 Oct; the line joins the snapshots on either side.
Ranking events
Entries, big moves, #1s and new versions we've recorded.
No events recorded yet
Events appear as the app enters charts, moves 25+ places or ships a new version.
More from MACIEJ KEDZIORA
Their other apps that Appulse has seen in the charts, charting ones first.
| App | Best rank now | Released | App Store |
|---|---|---|---|
 PushWardDeveloper Tools | Grossing · Developer ToolsUnited Kingdom#30 | 4 months ago |